
“When you have eliminated all which is impossible, then whatever remains, however improbable, must be the truth.” – Arthur Conan Doyle, The Case-book of Sherlock Holmes. This thought process cannot only help you solve a mystery, but it can help narrow the outlook for stocks.
For some context, in any one given year, PG stock has returned anywhere from positive 70%+ to negative 40%+. Over any two years, PG stock has returned anywhere from positive nearly 60% to negative about 30%. As you can see graphically in the three separate charts below, for the years 1998, 2009, and 2022, which are represented by the bars as possible returns. The gray areas are returns that are statistically impossible, while the green and red areas are still possible, and therefore probable.
1998: It was the best of times
Heading into December of 1998, stocks had achieved some of the most outstanding performance we’ve seen.
Statistically, given that performance, we could eliminate the possibility of having another one-year performance of above positive 10%. Represented by the grayed areas.
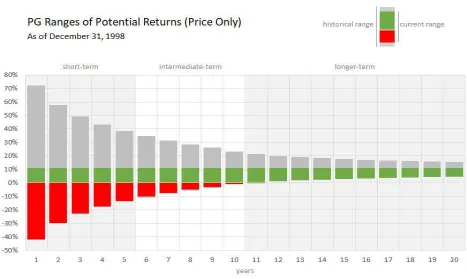
Having eliminated the possible returns, we were left with the probable returns. You’ll notice that a vast majority of the probable return are negative, as noted by the red-filled area. Should you have been making a short-term decision regarding PG stock, this analysis suggests the odds were not in your favor heading into 1999. We all know what happened after that.
Our analysis suggests that it will take about 5+ years for the odds of a positive return to be in your favor.
2009: It was the worst of times
Coming out of the wreckage of the 2008 Financial Crisis, many were terrified of entering the market.
However, come March 2009, given the extremely negative performance for PG stock, our analysis suggests it was statistically impossible to have another negative year of performance.
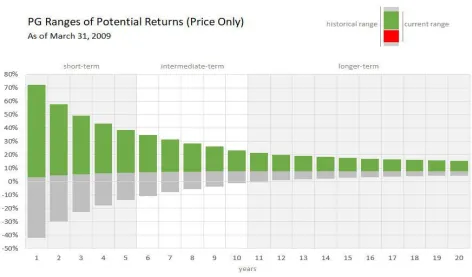
Having eliminated the possible returns, we were left with the probable returns. You’ll notice that the probable returns are, with statistical importance, all positive.
2022: It was the most average of times
Fast forward to November 30th, 2022. As you can see from the chart on the left, there are no grayed-out areas in the one-year time frame.
This would suggest that we cannot eliminate any return as impossible, leaving any one-year return as probable.
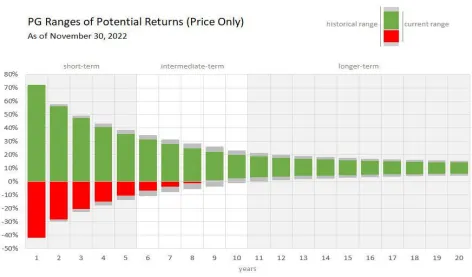

Through examining the two extremes of 1998 and 2009 we can identify when circumstances heavily lean one way or the other. Despite a nearly three-year stretch that will be talked about for decades to come, the market, and PG, are in an absolute average time.
Given all returns are possible, what does this mean for you? To answer this, you’ll have to examine what your timeframe is. If you are making a short-term decision, then you are at the market’s mercy. The market, on average, has been positive ~75% of the time in any one given year. On the other hand, if you extend your timeframe to 10 years, in any given 10-year rolling period, the market has been negative only 5% of the time.
Crew Capital Management Ltd. is a federally registered investment adviser under the Investment Advisers Act of 1940. Registration as an investment adviser does not imply a certain level of skill or training. For more information please visit: https://adviserinfo.sec.gov/ and search for our firm name. This is not to be construed as an offer or a recommendation to buy or sell a security.
This is prepared for informational purposes only. It does not address specific investment objectives. Information in these materials are from sources Crew Capital Management Ltd. deems reliable, however, we do not attest to their accuracy.
PAST PERFORMANCE IS NO GUARANTEE OF FUTURE PERFORMANCE